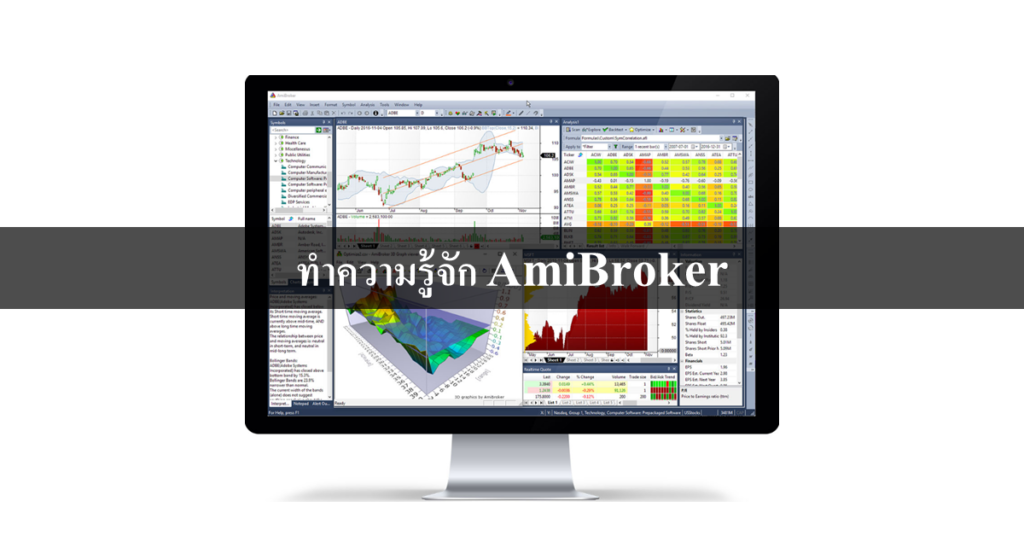
แนะนำความสามารถและคุณสมบัติของโปรแกรม AmiBroker อย่างละเอียด พร้อมภาพตัวอย่างจากโปรแกรม รวมถึงวิดีโอสอนและข้อมูลอื่นๆที่เกี่ยวข้อง
ฟรีคอร์สสอนมือใหม่เริ่มต้นเรียนรู้ AmiBroker
AmiBroker Key Features
คุณสมบัติเด่นของ AmiBroker
ทรงพลัง ใช้งานง่าย และสวยงาม
ทำการลากวางเส้นค่าเฉลี่ย ตีกรอบราคาหุ้น และเพิ่มอินดิเคเตอร์เหนือบนอินดิเคเตอร์อีกตัวได้อย่างง่ายดาย และยังสามารถปรับค่าพารามิเตอร์ให้เห็นผลลัพท์ทันทีด้วยสไลด์ และปรับแต่งกราฟได้หลากหลายรูปแบบเพื่อประโยชน์ในการวิเคราะห์หุ้นและความสวยงาม
Powerful, easy-to-use and beautiful charts
ความเร็วสูงสุดในทำการทดสอบและการเพิ่มประสิทธิภาพที่ดีสุด
ความเร็วในการคำนวณและวิเคราะห์ที่เหลือเชื่อ มาพร้อมกับความสามารถขั้นสูง เช่น: การบริหารเงินขั้นสูง การจัดลำดับเข้าซื้อแบบหมุนเวียน การสร้างตัวชี้วัดคุณภาพการเทรดและการทดสอบขึ้นเอง และสนับสนุนค่าสกุลเงินหลากหลาย (การเพิ่มประสิทธิภาพที่ดีสุด คือ Optimization)
The world’s fastest portfolio backtesting and optimization
การทำงานอัตโนมัติและชุดการประมวลผล
ประหยัดเวลาและแรงงานในการทำกระบวนการซ้ำๆ โดยให้ AmiBroker ช่วยจัดการงานวิเคราะห์หุ้นที่ต้องประจำทุกวันด้วยชุดคำสั่งกระบวนการอัตโนมัติแบบเบ็ดเสร็จ (Integrated Batch) ผู้ใช้ไม่ต้องคลิ๊กเมาส์ซ้ำๆทุกๆวันอีกต่อไป เพียงตั้งค่าใน Windows Schedulers สั่งให้ AmiBroker เริ่มทำงาน ในขณะที่ผู้ใช้กำลังพักผ่อนอยู่ (อีกวิธีคือการเขียนโปรแกรมขึ้นมาเองแล้วเชื่อมต่อไปยัง OLE Automation)
Automation and batch processing
All the information at your fingertips
ข้อมูลวิเคราะห์ที่เพียบพร้อมภายใต้ปลายนิ้ว
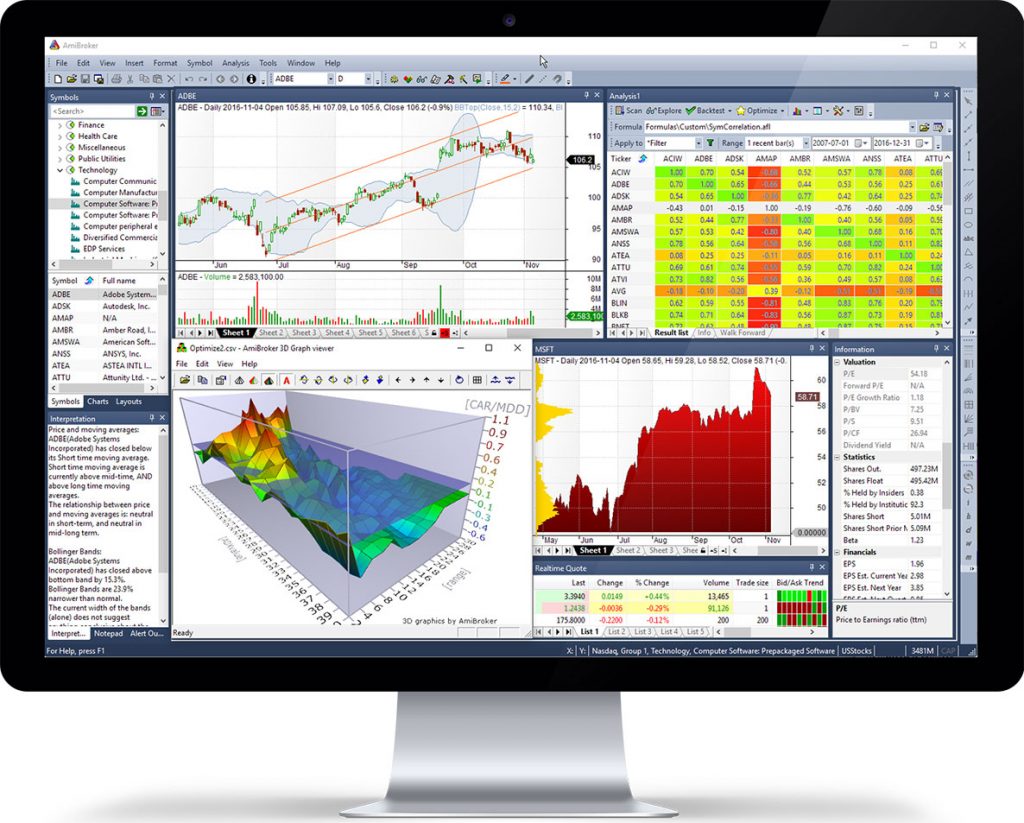
หน้าจอโปรแกรมยืดหยุ่นที่สามารถจัดวางและปรับเปลี่ยนได้ตามความต้องการของผู้ใช้ รวมถึงการตั้งค่าการใช้งานกับจอคอมพิวเตอร์หลายจอ
หน้าต่างรายชื่อหุ้น
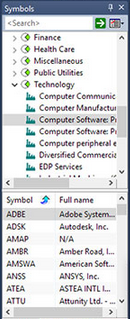
AmiBroker สามารถทำการจัดหมวดหมู่หุ้นได้หลายประเภทตามตลาดหุ้นประเทศนั้นๆ ตามกลุ่ม ตามภาคธุรกิจ ตามประเภทอุตสาหกรรม และตามลิสรายชื่อที่ต้องการ สามารถค้นหาหุ้นจากชื่อได้อย่างรวดเร็ว และยังสามารถใช้หมวดหมู่ที่จัดไว้ในการกรองและวิเคราะห์หุ้นตามที่ผู้ใช้ต้องการ
Symbols Window
เครื่องมือสร้างและวาดกราฟ
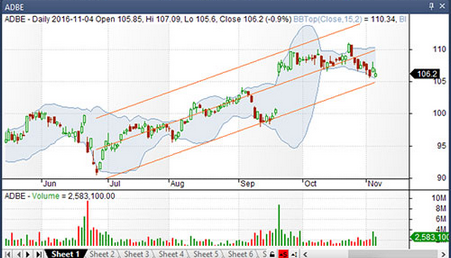
AmiBroker มีกราฟและเครื่องมือวาดกราฟที่ได้มาตราฐาน โดยที่ผู้ใช้สามารถปรับเปลี่ยนได้ตามความต้องการ และยังประกอบด้วยอินดิเคเตอร์ร้อยกว่าตัวพร้อมให้เลือกใช้ เช่น MACD, RSI, Stochastics, และ ADX/DMI เป็นต้น
Charts and drawing tools
หน้าต่างวิเคราะห์หุ้น
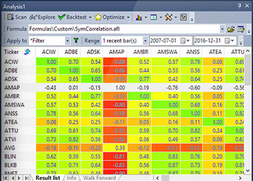
รูปข้างต้นแสดงตัวอย่างการสร้างความสัมพันธ์ระหว่าง รายชื่อหุ้นที่ผู้ใช้ได้ระบุไว้ ซึ่งเป็นหนึ่งในความสามารถหลากหลายซึ่งผู้ใช้สามารถทำได้กับการสำรวจ (AmiBroker Exploration)
Analysis Window
หน้าต่างตีความหมาย
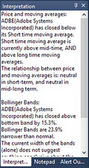
AmiBroker Interpretation สามารถสร้างบทความบรรยายโดยอัตโนมัติจากสูตรที่ผู้ใช้ได้ระบุไว้ ซึ่งมีให้เลือกทั้งแบบสำเร็จรูปมาพร้อมโปรแกรม และแบบผู้ใช้สร้างขึ้นมาใหม่ด้วยตนเอง
Interpretation window
กราฟ 3 มิติ การหาประสิทธิภาพสูงสุด
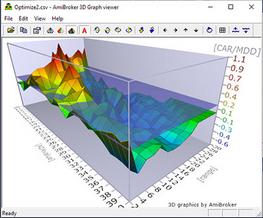
กราฟ 3 มิติ ช่วยในการค้นหาการรวมกันที่หลากหลายของตัวแปรเพื่อให้ได้ประสิทธิภาพและความเสถียรที่สุด โดยตัวกราฟสามารถหมุน ทำเอนิเมชั่น และจัดองศาได้ในทุกๆมุม อีกทั้งมี แผ่นผิวระดับน้ำ (Water Level) ที่สามารถถูกปรับเปลี่ยนให้เหมาะสมแม่นยำในการวิเคราะห์จุดสูงสุด (Peak ) และต่ำสุด (Valley) ในกราฟ ณ ระดับหรือช่วงต่างๆกัน
3D optimization chart
กราฟลาดสีและโปรไฟล์ตลาด
กราฟทุกตัวใน AmiBroker สามารถแสดงผลแบบลาดสี (Gradient) เช่น สีแดงเข้มไปยังสีแดงอ่อนในรูปข้างบน ส่วนกราฟสีเหลืองด้านขวาแสดงปริมาณซื้อขายหุ้นที่ระดับราคาต่างๆ (Volume-at-Price Chart) ซึ่งทำให้สังเกตุระดับราคาหุ้นที่มีการซื้อขายมากๆ เพื่อหาแนวรับแนวต้านที่เหมาะสม
Gradient chart and market profile
หน้าต่างข้อมูลราคาหุ้นและข้อมูลพื้นฐานหุ้น
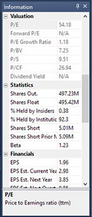
สามารถเข้าถึงข้อมูลหุ้นได้ในทันที และสามารถนำข้อมูลพื้นฐานไปใช้ในการวิเคราะห์หุ้นด้วยการเขียนโค้ดได้อีกด้วย
Information window
Powerful tools for the system traders
เครื่องมือทรงพลังสำหรับนักลงทุนด้วยระบบ
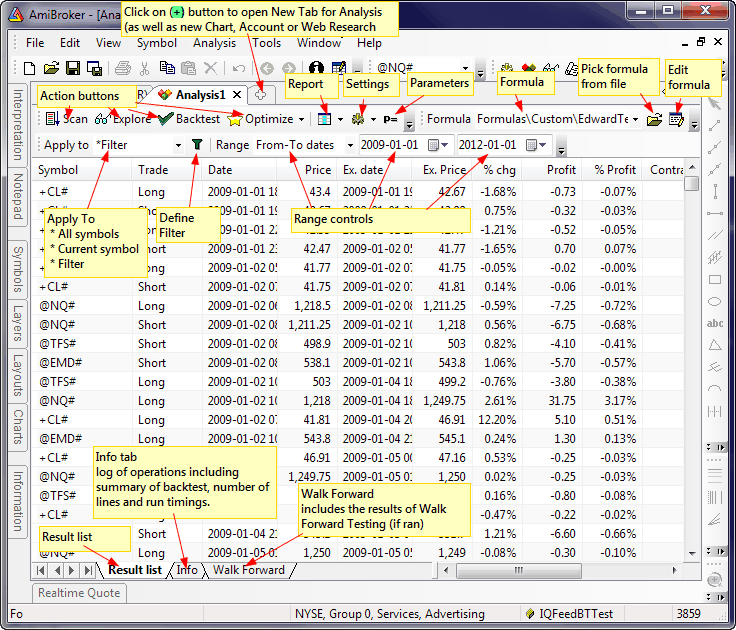
หน้าต่างวิเคราะห์หุ้น
หน้าต่างวิเคราะหุ้น (Analysis Window) ที่สามารถใช้ในการสแกนหุ้น การสำรวจหุ้น การทดสอบพอร์ต การหาค่าประสิทธิภาพสูงสุด การทดสอบแบบก้าวไปข้างหน้า และการจำลองการเทรดหุ้น บนหน้าต่างเดียวกัน
The Analysis window
คัดกรองสภาพตลาดเพื่อหาโอกาสการลงทุน
การสำรวจหุ้นซึ่งนำไปใช้ได้ในหลายจุดประสงค์สามารถถูกควบคุมการแสดงผลในรูปแบบตารางได้ด้วยโค้ด โดยไม่มีข้อจำกัดทางด้านจำนวนแถวและจำนวนคอลัมน์
Screen markets for opportunities
การทดสอบระบบวิเคราะห์และเทรดหุ้น
การทดสอบย้อนหลังสามารถวัดประสิทธิภาพระบบเทรดหุ้นของผู้ใช้จากข้อมูลราคาหุ้นในอดีต โดยการจำลองการเทรดหุ้นถูกวิเคราะห์ที่ระดับพอร์ตหุ้นซึ่งให้ค่าสมจริง มีการเทรดซื้อขายที่เวลาเดียวกันตามโค้ดที่ผู้ใช้เขียนไว้
Test your system
การให้คะแนนและจัดลำดับหุ้นที่น่าเข้าซื้อ
ในกรณีที่มีสัญญาณเข้าซื้อหุ้นหลายตัวในวันเดียวกัน AmiBroker สามารถทำการให้คะแนนและจัดลำดับหุ้นที่น่าเข้าซื้อก่อนหลังตามที่ผู้ใช้ต้องการด้วย PositionScore และจำนวนเงินสดที่เหลืออยู่ (และยังสามารถวิเคราะห์กรณีจำกัดปริมาณการเข้าซื้อภายใต้เงื่อนไขสภาพคล่อง Liquidity ของหุ้นตัวนั้นๆได้อีกด้วย)
Scoring & ranking
ค้นหาค่าตัวเลขการวิเคราะห์หุ้นที่ได้ประสิทธิภาพสูงสุด
AmiBroker สามารถทำการค้นหาองค์ประกอบของตัวแปรเพื่อให้ได้ประสิทธิภาพสูงสุดด้วยวิธีการทดสอบทุกกรณีที่เป็นไปได้ (Brute-force Search หรือเรียกอีกอย่างว่า Exhaustive Search) และกรณีการหาประสิทธิภาพขั้นสูงด้วยวิธีอื่นๆเพื่อลดระยะเวลาในการค้นหา เช่น Particle Swarm และ CMA-ES
Find optimum parameter value
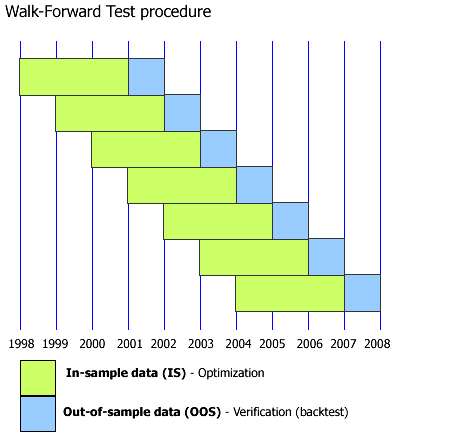
การทดสอบแบบก้าวไปข้างหน้า
เพื่อหลีกเลี่ยงหลุมพลาง Overfitting มีความจำเป็นอย่างยิ่งที่ต้องตรวจสอบความมั่นคงแข็งแรงของระบบด้วย การทดสอบแบบก้าวไปข้างหน้า (Walk Forward Analysis) กับข้อมูล Out-of-Sample Data หลังจากที่มีการหาค่าประสิทธิภาพสูงสุดกับข้อมูล In-Sample Data
Walk-forward testing
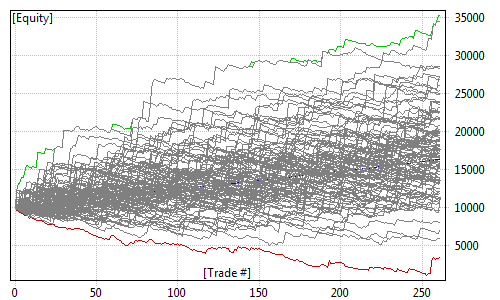
จำลองการเทรดหุ้นและวิเคราะห์ความเสี่ยงบนความผันผวน
เพื่อเตรียมตัวรับมือกับสภาพตลาดที่ไม่เอื้ออำนวย ผู้ใช้สามารถตรวจสอบกรณีสถานะการณ์ย่ำแย่ที่สุด และความน่าจะเป็นล่มจม (อันนี้แปลแบบขำๆ แต่เห็นภาพชัดเจน) จากข้อมูลสถิติเชิงลึกจากระบบเทรดหุ้นของผู้ใช้ ที่ได้ผ่านการจำลองการเทรดหุ้น Monte Carlo Simulation
Monte Carlo Simulation
Concise and fast formula language to express your trading ideas
ภาษาโปรแกรมกระทัดรัดและรวดเร็วในการแสดงไอเดียเทรดหุ้น
ภาษาโปรแกรมกระทัดรัด ทำให้เขียนโค้ดน้อยลง
ระบบเทรดหุ้นและอินดิเคเตอร์ที่ถูกเขียนด้วยภาษา AmiBroker AFL สั้นกระทัดรัดกว่าภาษาบนโปรแกรมอื่นๆ เพราะคำสั่งส่วนมากมักถูกโค้ดภายในบรรทัดเดียว (ซึ่งในส่วนนี้ ยังมี ThaiQuants AFL Template เพื่อเป็นแนวทางในการจัดวางโค้ดให้เป็นระเบียบ ตรวจสอบและดัดแปลงแก้ไขได้ง่าย)
Concise language means less work
คำนวณและวิเคราะห์อย่างรวดเร็ว
ภาษา AmiBroker AFL ใช้การเก็บข้อมูลหุ้นเป็นแบบ Array แล้วคอมไพล์เป็นภาษาคอมพิวเตอร์ เพื่อเร่งการคำนวนผล และไม่จำเป็นต้องเขียนโค้ดวนลูปเอง ทำการเขียนโค้ดง่ายขึ้นและประมวลผลเร็วขึ้นมาก
Fast array and matrix processing
โค้ดน้อยลง วิเคราะห์ผลลัพท์เร็วขึ้น
ความสามารถในการเขียน AmiBroker Code Snippet โค้ดช่วยสำเร็จรูป ที่ใช้บ่อยๆขึ้นเอง เพื่อนำไปใช้ในหลายๆกลยุทธการเทรด ในหลายๆไฟล์อย่างง่ายดาย ทำให้โค้ดน้อยลง วิเคราะห์ผลลัพท์เร็วขึ้น
Less typing, quicker results
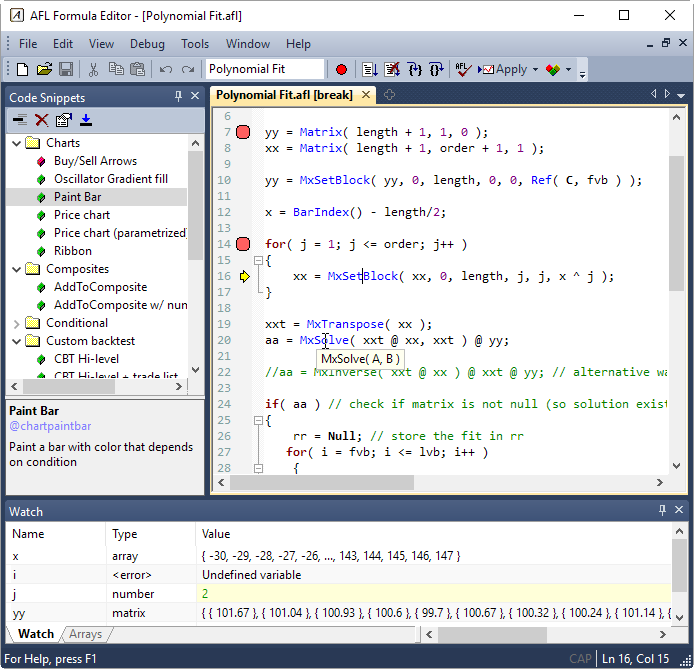
ตัวช่วยตรวจสอบโค้ด
AmiBroker Debugger ซึ่งสามารถวิเคราะห์โค้ดที่ล่ะบรรทัด ในทุกๆตัวแปร เพื่อเพิ่มความเข้าใจโค้ดนั้นๆว่ากำลังทำงานเช่นไร คำนวนได้ค่าเท่าไหร่
Built-in debugger
ตัวช่วยเขียนโค้ดที่ชาญฉลาด
AFL Formula Editor ของ AmiBroker ช่วยไฮไลท์โค้ด ช่วยเขียนโค้ด ช่วยบอกสิ่งที่จำเป็น ช่วยจัดระเบียนโค้ด และอื่นๆที่เกี่ยวข้องกับการเขียนโค้ด เพื่ออำนวยความสะดวกในการเขียนโค้ดที่ถูกต้องอย่างเป็นระเบียบ
State-of-the-art code editor
การใช้หน่วยประมวลผลหลายตัวพร้อมกัน
AmiBroker สามารถใช้คุณประโยชน์ของ Multi-Treading จาก Multiple Processors/Cores ในการวิเคราะห์กลยุทธเทรดหุ้นได้ถึง 32 Threads เพื่อเพิ่มความเร็วขึ้นมากกว่า 4-8 เท่าของคอมพิวเตอร์ทั่วไป
Multi-threading
เพิ่มเติม